Scrum in the Age of AI: Are Sprints Shrinking from Weeks to Days?
AI speeds up coding, but work still waits for decisions, reviews and tests. What to know before you shorten your sprints.
Articles / Agile Ways of Working
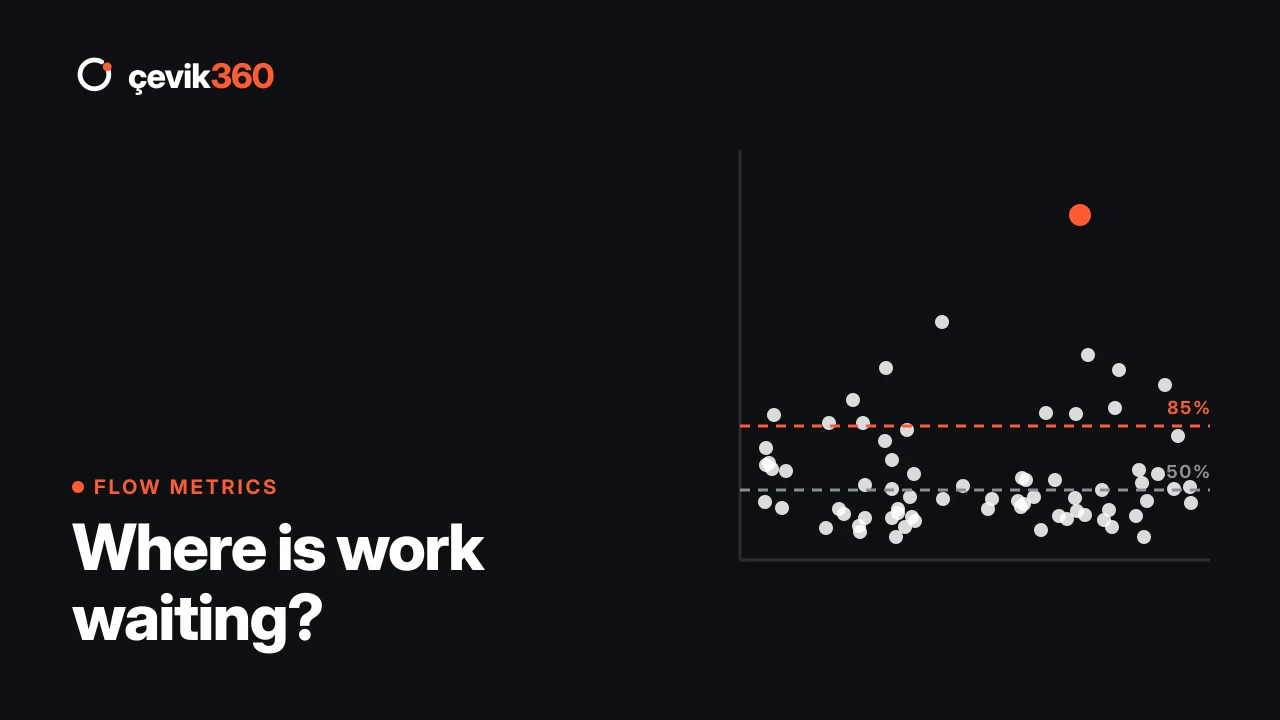
Ask an organisation why things take so long and the answer is usually “we’re very busy”. Everyone is occupied, calendars are full, boards are crowded. Yet from the customer’s point of view, work moves slowly. The reason for this contradiction is simple: most of the time, work isn’t being worked on; it’s waiting. Nobody is idle. The work is.
To see the waiting you don’t need more reports; you need a few of the right metrics. The Kanban Guide defines four basic flow measures. In this article we look at what each one tells you, how to read it and the most common mistakes, with examples from the field.
Definition: the number of work items started but not finished.
WIP is the most overlooked and most powerful lever of flow. The more work a team starts at the same time, the slower each item finishes, because of context switching, divided attention and items getting in each other’s way.
A picture we often see: a team of five has twenty items in “in progress”. Everyone juggles four things and nothing finishes. The first improvement here is not a new tool or a new role, but a WIP limit: “this column can hold at most six items.” When the limit is reached, instead of starting something new, people help finish what is stuck.
Stop starting, start finishing.
Definition: the elapsed time from when a work item starts to when it finishes.
Cycle time is the metric closest to the customer’s experience. Once a request is “started”, how many days until it is delivered? Here you need to look at the distribution, not the average. A team with an average cycle time of six days may finish some items in two days and others in thirty. It’s the long tail that hurts customers.
The best way to show cycle time is a scatterplot: finish date on the horizontal axis, days on the vertical. Draw the 50th, 85th and 95th percentile lines and you can tell your team and stakeholders: “85% of our items finish in nine days or less.”
The Kanban Guide calls this a service level expectation: a period of time combined with a probability. The guide’s example is “85% of work items finish in 8 days”. A sentence based on history rather than estimates makes the “when will it be done?” conversation far healthier.
Definition: the number of work items finished per unit of time.
Throughput shows a team’s delivery capacity, counted per week or per day. Using the number of finished items instead of estimate-based units like story points keeps measurement simple and indisputable. When items are kept roughly similar in size, this number becomes a surprisingly good forecasting tool.
Throughput’s most valuable use is forecasting. You can answer “when will these 40 items be done?” probabilistically, using past throughput. We’ll cover this in detail with Monte Carlo simulation in an upcoming article.
Definition: the time elapsed since a work item started.
The other three metrics describe the past; work item age describes today. Cycle time can only be calculated once an item is finished. If an item has been stuck for forty days, you only see it on the cycle time chart when it finally finishes, and by then it’s too late.
That’s why work item age is the best guide for the daily meeting. Show on every card how many days it has been open. Flag items whose age is approaching your service level expectation. Make this the first question of the daily: “Which is our oldest item, and how do we move it today?”
From the field: finding dozens of items that nobody has touched for months is common. They should either be closed or genuinely prioritised. Ageing work is hidden debt: it clutters the board and creates false expectations for the stakeholders waiting on it.
These four measures are not independent. The relationship known in flow theory as Little’s Law says that, when the system is reasonably stable:
Average cycle time = Average WIP ÷ Average throughput
So if you halve WIP without changing throughput, average cycle time also roughly halves. Starting less work at the same time is the cheapest way to finish work faster, far cheaper than telling the team to work faster.
Alongside the four basic metrics, we often use one more indicator: flow efficiency, the share of an item’s total time in which someone is actively working on it. A reference often quoted in the Kanban community puts it at around 15% for teams that don’t focus on flow, meaning work spends about 85% of its life waiting. Above 40% is considered good.
To measure flow efficiency, show waiting states as separate columns on the board: “Waiting for test”, “Waiting for approval”, “With another team”. Once these columns are visible, where the waiting builds up becomes obvious, without any debate.
Most tools (Jira, Azure DevOps and others) already hold this data. What is usually missing is not data but a rhythm in which the data is read regularly and turned into decisions. You can find our approach to flow measurement and Kanban coaching on the services page. To see together where your work waits, start with our free 360 assessment.
AI speeds up coding, but work still waits for decisions, reviews and tests. What to know before you shorten your sprints.
The eight most common mistakes in agile adoption, from ignoring culture to limiting team autonomy, and how to avoid them.
What is Scrum@Scale and how does it work? Scrum of Scrums, MetaScrum, the Executive Action Team and the two cycles; how it differs from SAFe and LeSS.
In a 30-minute call, let's find the bottlenecks in your flow together.